Today, we released the latest issue of the Domain Name Industry Brief, which showed that the Internet grew by approximately 15 million domain names in the fourth quarter of 2015, and closed with a base of 314 million domain names across all top-level domains (TLDs). That’s a 5 percent increase over the third quarter of 2015. [1]
.COM AND .NET BREAKDOWN
The .com and .net TLDs experienced aggregate growth, reaching a combined total of approximately 139.8 million domain names in the domain name base in the fourth quarter of 2015. [2] In the fourth quarter, Verisign processed 12.2 million new domain name registrations for .com and .net, as compared to 8.2 million domain names for the same period in 2014.
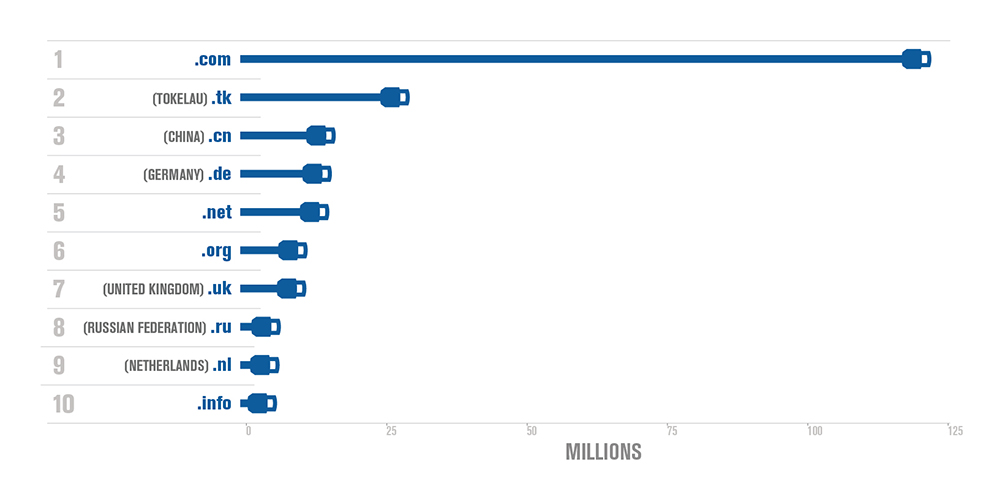
TLD BREAKDOWN
In the fourth quarter of 2015, the top 10 TLDs in order by zone size were:
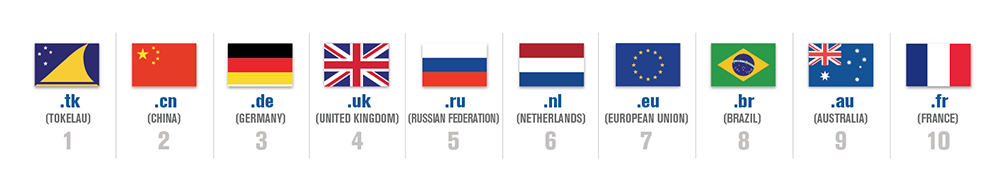
CCTLD BREAKDOWN
Country-code top-level domains (ccTLDs) reached 144.4 million domain names at the end of Q4 2015, with an increase of 6.6 million domain names, or a 4.8 percent increase compared to the third quarter of 2015. As of Dec. 31, 2015, the top 10 ccTLDs by zone size were:
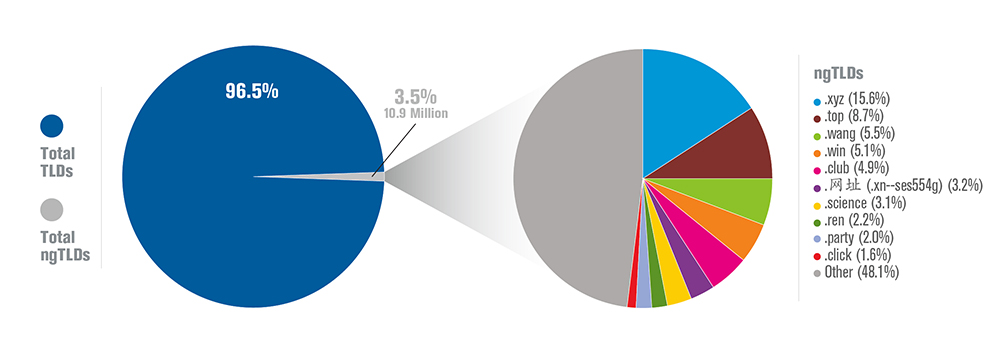
NEW GTLD BREAKDOWN
At the end of Q4 2015, new gTLD (ngTLDs) registrations totaled 10.9 million, which represents 3.5 percent of total domain name registrations. The top 10 ngTLDs represented 51.9 percent of all ngTLD domain name registrations. The following charts show ngTLD domain name registrations as a percentage of overall TLD domain name registrations, and also the top 10 ngTLDs as a percentage of all ngTLD domain name registrations.
DNS QUERY LOAD
Verisign’s average daily Domain Name System (DNS) query load during the fourth quarter of 2015 was 123 billion across all TLDs operated by Verisign, with a peak of 194 billion. Quarter over quarter, the daily average increased 2.8 percent and the peak decreased by 67.3 percent. Year over year, the daily average increased 11.9 percent and the peak increased 32.6 percent.
For more domain stats from the fourth quarter of 2015, check out the Q4 2015 infographic below and the latest issue of the Domain Name Industry Brief.

From Visually.
1. The generic top-level domain (gTLD) and ccTLD data cited in the DNIB report are estimates as of the time the report was developed, and is subject to change as more complete data is received. Total includes ccTLD Internationalized Domain Names.
2. The domain name base is the active zone plus the number of domain names that are registered but not configured for use in the respective Top-Level Domain zone file plus the number of domain names that are in a client or server hold status.